Literature Sharing: Multiplex Immunohistochemistry Accurately Defines the Tumor Microenvironment of Metastatic Melanoma
I. Research Background
Increased numbers of tumor-infiltrating lymphocytes (TILs) are closely associated with favorable clinical outcomes in various human cancers. These cells were initially identified and defined by pathologists in hematoxylin-eosin (H&E) stained sections, and their distribution and quantity are important prognostic indicators for melanoma. Over 35 years of development, the concept of TILs has evolved into three different connotations: in addition to the aforementioned pathological classification, it can also refer to lymphocytes isolated from melanoma biopsy tissues, analyzed by flow cytometry (FACS), and tested for anti-tumor response capabilities, as well as adoptive immunotherapy T cells isolated from tumor tissues of patients with metastatic melanoma, expanded in vitro, and infused back into the body after lymphodepletion. Despite the important clinical value of all three concepts, the flexible use of terminology has caused semantic confusion in their precise definition. To clarify this issue, this study combined FACS with multiplex immunohistochemistry to conduct comparative analysis of the tumor immune microenvironment characteristics of melanoma patient biopsy tissues. Among these, multiplex immunohistochemistry is a powerful tool for analyzing the tumor immune microenvironment, which can achieve precise identification of immune cell subsets in tissues and clear distinction of melanoma cells through OPAL staining kits containing monoclonal antibodies with specific markers, combined with tumor-specific markers such as SOX-10. After imaging, it can analyze the planar coordinates of each cell in tissue sections, accurately determining whether immune cell subsets are true TILs located within the tumor parenchyma or tumor-associated lymphocytes in the tumor stroma, thereby objectively quantifying the quantity and distribution of immune cell subsets and clearly revealing the microenvironmental heterogeneity between "T cell-infiltrated" and immune-excluded tumors. While FACS can detailedly analyze the T cell subset characteristics, differentiation status, and immune checkpoint molecule expression of melanoma TILs, it loses critical cytohistological localization information because it requires tissue preparation as single-cell suspensions for detection. Based on this, the study "Multiplex immunohistochemistry accurately defines...
II. Research Methods
Surgically resected tumor tissues were divided into two parts for sample processing: one part was formalin-fixed and paraffin-embedded for multiplex immunohistochemistry (mIHC) detection, and the other part was prepared as single-cell suspensions for FACS detection. For multiplex immunohistochemistry, paraffin sections were sequentially dewaxed and rehydrated with xylene and graded ethanol, then subjected to initial heat-induced epitope retrieval (HIER) in 1mM EDTA buffer (pH 8.0) at 125°C for 3 minutes, followed by adjustment to microwave heating retrieval method according to the antibody type used. The experiment used rabbit monoclonal CD4, CD3, PD-L1, and CD11c antibodies, mouse monoclonal CD8, SOX10, CD20, and CD68 antibodies, and rabbit polyclonal FOXP3 antibody. After primary antibody incubation, endogenous peroxidase activity was blocked with 0.3% hydrogen peroxide solution, then immune fluorescence signal visualization was achieved through the OPAL 7-color fluorescence immunohistochemistry kit combined with TSA dye, and counterstained with Spectral DAPI. Finally, images were acquired using the Vectra automated imaging system and analyzed with inForm software for cell segmentation and phenotypic analysis. For FACS detection, tumor tissues were mechanically and enzymatically digested to prepare single-cell suspensions, filtered through a 70μm cell strainer, and red blood cells were lysed. The cells were then stained with two FACS antibody panels to detect TILs differentiation markers, T cell subsets, differentiation markers, immune checkpoints, and activation markers, respectively. Data were acquired using a BD LSR II flow cytometer and analyzed with FlowJo v10 software for gating and analysis, with Mann-Whitney test used for statistical analysis.
III. Core Research Results
mIHC Accurate Analysis of the Immune Microenvironment in Metastatic Melanoma
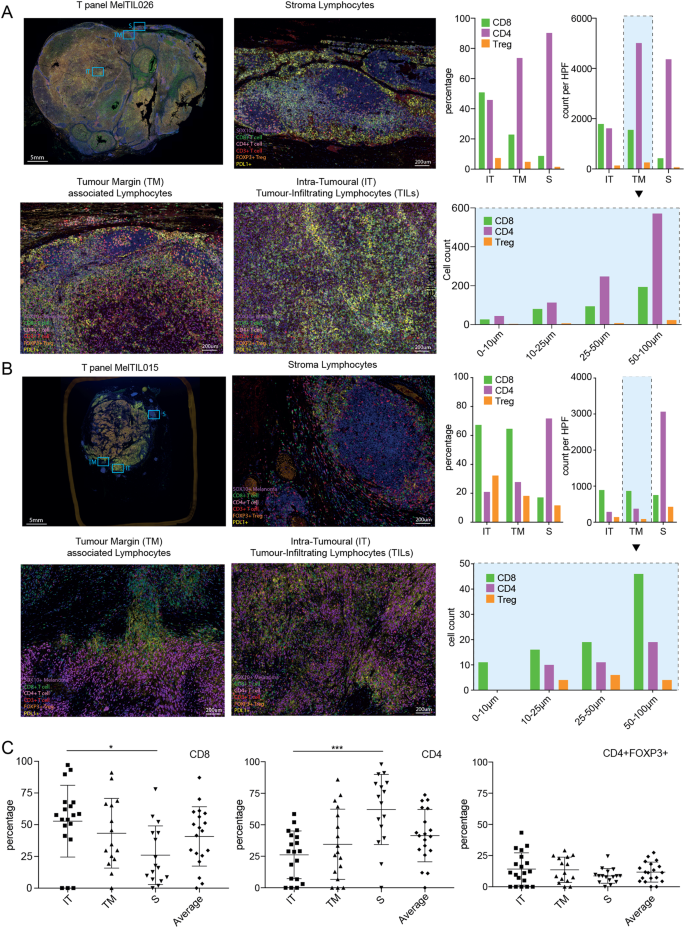
To clarify the distribution differences, density characteristics, and distance correlation with the tumor margin of different T cell subsets (CD8⁺ T cells, CD4⁺ T cells, regulatory T cells/Treg) in three regions (intratumoral, tumor margin, and tumor stroma) of metastatic melanoma tissues, and to lay the foundation for subsequent comparison of mIHC and FACS data and construction of immune microenvironment models, this study conducted related experiments through multiplex immunohistochemistry technology. Formalin-fixed paraffin-embedded melanoma tissue sections were selected, and OPAL staining kits were used to stain SOX10, PD-L1, CD3, CD8, CD4, and FOXP3. Images were acquired using the Vectra automated imaging system and analyzed with inForm software for cell segmentation and phenotypic analysis, quantifying the number and proportion of different T cell subsets in each high-power field. Meanwhile, the distance from immune cells to the tumor margin was measured using MetaMorph software. The results showed significant differences in the distribution of T cell subsets among different regions: CD8⁺ T cells and CD4⁺ T cells were more abundant in the tumor margin and stroma, while Tregs were relatively concentrated in the stroma. The density of immune cells decreased with increasing distance from the tumor margin, and there were significant individual differences in immune infiltration levels among different patients.
mIHC Reveals Broader Immune Microenvironment Characteristics of Metastatic Melanoma
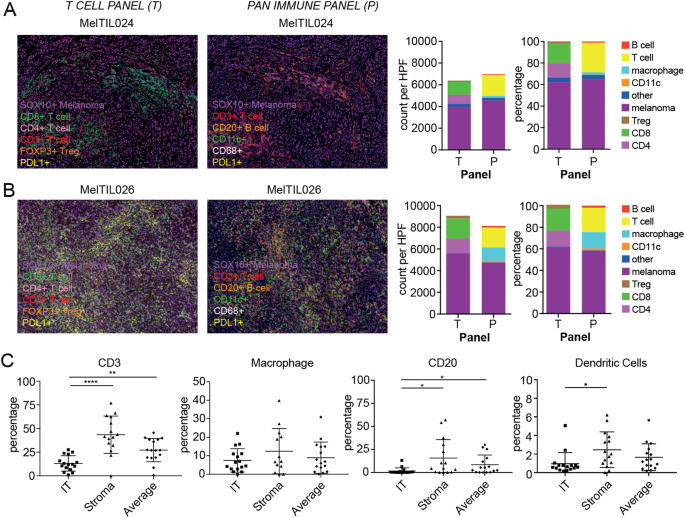
Based on the previous precise analysis of T cell subset distribution, to further expand the range of immune cell detection and improve the overall picture of the immune microenvironment in metastatic melanoma, this study conducted in-depth detection of the distribution characteristics of T cells (CD3⁺), B cells (CD20⁺), macrophages (CD68⁺), and dendritic cells (CD11c⁺) through mIHC technology. The experiment used the same tissue sections as before for OPAL staining, acquired high-power field images using the Vectra automated imaging system, and quantified the number and proportion of each immune cell subset in the three tumor regions using inForm software, followed by inter-group statistical analysis. The overall results showed significant differences in overall immune infiltration levels among different patients: for example, MelTIL024 had less immune cell infiltration, almost no PD-L1 expression, and T cells mainly distributed in the stromal region, while MelTIL026 had rich immune infiltration, with a large number of T cells as well as certain numbers of macrophages, B cells, and dendritic cells. Statistical analysis revealed that the proportion of T cells was significantly higher in the tumor margin compared to the intratumoral region, while B cells and macrophages were more abundant in the stromal region.
FACS Analyzes the Phenotype, Differentiation, and Immune Checkpoint Expression Characteristics of Melanoma TILs
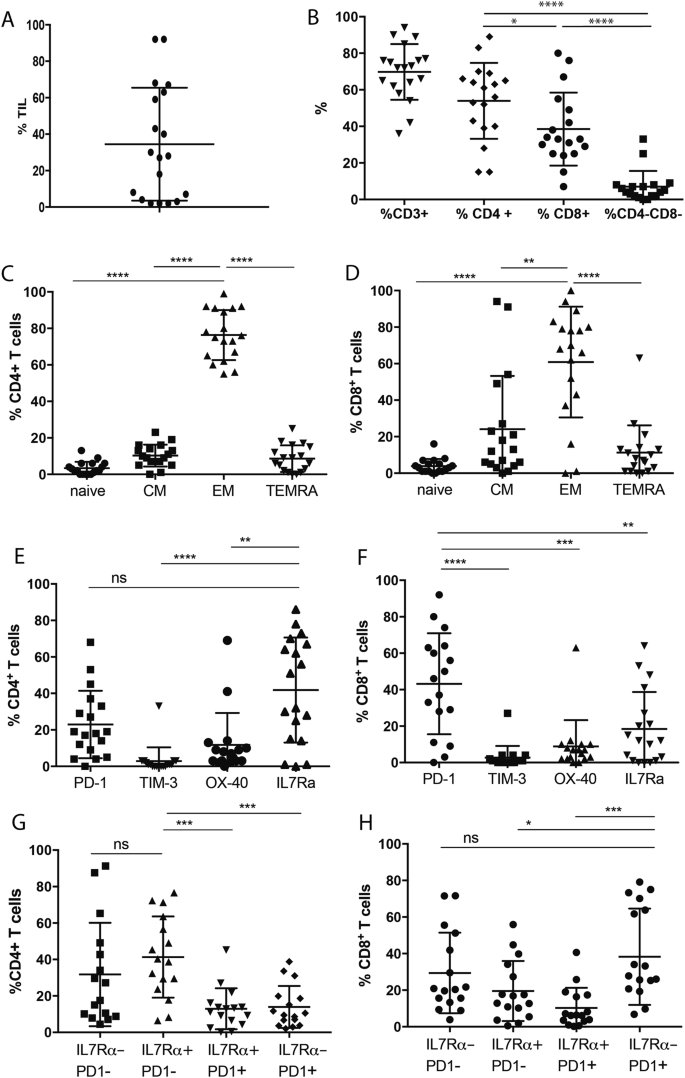
Leveraging the multi-parameter detection advantages of flow cytometry, this study focused on analyzing the overall proportion, T cell subset composition, differentiation status, and immune checkpoint molecule expression characteristics of melanoma tumor-infiltrating lymphocytes, with the aim of providing reliable experimental basis for subsequent comparison of mIHC and FACS data and analysis of T cell functional status. The experiment prepared single-cell suspensions from melanoma biopsy tissues, stained with two FACS antibody panels to detect TILs differentiation markers, T cell subsets, differentiation markers, immune checkpoints, and activation markers, respectively. Data were acquired using a BD LSR II flow cytometer and analyzed with FlowJo v10 software for gating and analysis, with Mann-Whitney test used for statistical analysis. The results showed significant individual heterogeneity in the proportion of TILs among melanoma patients: T cells were the dominant subset in TILs, with CD4⁺ T cells accounting for a higher proportion than CD8⁺ T cells. Both CD4⁺ and CD8⁺ T cells showed different differentiation states, with a higher proportion of effector memory T cells. Immune checkpoint molecule analysis revealed that PD-1 and CTLA-4 were highly expressed on CD8⁺ T cells, while LAG-3 and TIM-3 expression levels were relatively lower. There was a positive correlation between immune checkpoint expression and T cell activation status, suggesting that T cells in the tumor microenvironment were in a state of chronic activation and exhaustion.
mIHC and FACS Detection of TILs Data in Melanoma are Complementary
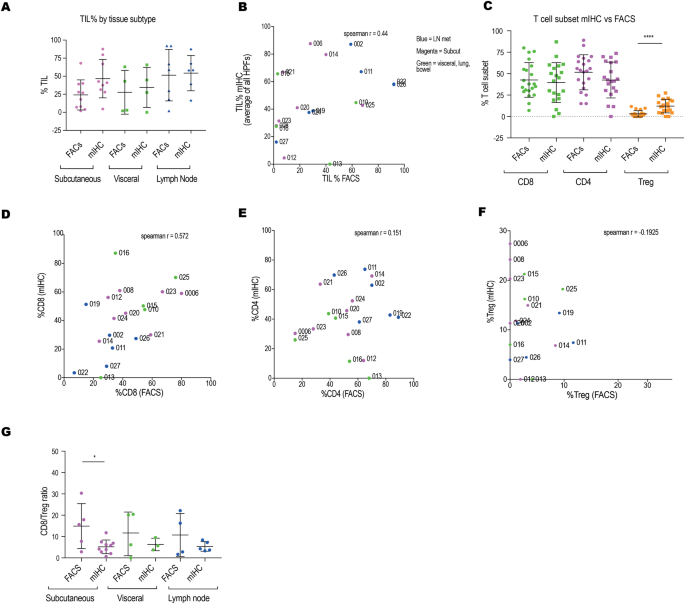
To clarify the consistency and differences between mIHC and FACS in detecting TILs-related indicators, identify the core reasons for differences, and the complementary value of the two techniques, thereby providing support for subsequent data integration and improvement of the tumor immune microenvironment assessment system, this study conducted a systematic comparison of the detection results of the two techniques. The experiment selected 21 melanoma biopsy samples, detecting the overall proportion of TILs, the proportions of CD8⁺, CD4⁺ T cells, and Tregs, and the CD8:Treg ratio through mIHC and FACS respectively. Mann-Whitney test was used to compare the differences between the two techniques, and Spearman correlation analysis was used to test data correlation. The comparative analysis of the detection data of the two techniques showed that after grouping by metastasis site, there was no statistical difference in the overall proportion of TILs detected by the two techniques, but the correlation of paired sample data was poor, with extreme outliers. The reason for this lies in the fact that mIHC can distinguish cell tissue localization while FACS cannot. The proportions of CD8⁺, CD4⁺ T cells, and Tregs detected by the two techniques showed different trends, with mIHC detecting a higher proportion of Tregs in the stromal region. The CD8:Treg ratio was higher in mIHC than in FACS, suggesting that the spatial distribution of immune cells affects the assessment of their functional status. Despite the differences, the two techniques showed consistency in detecting overall immune infiltration trends, indicating their complementary value in tumor immune microenvironment analysis.
mIHC Clarifies the Expression Cell Types and Localization of PD-L1 in Metastatic Melanoma and Its Association with CD8⁺ T Cells
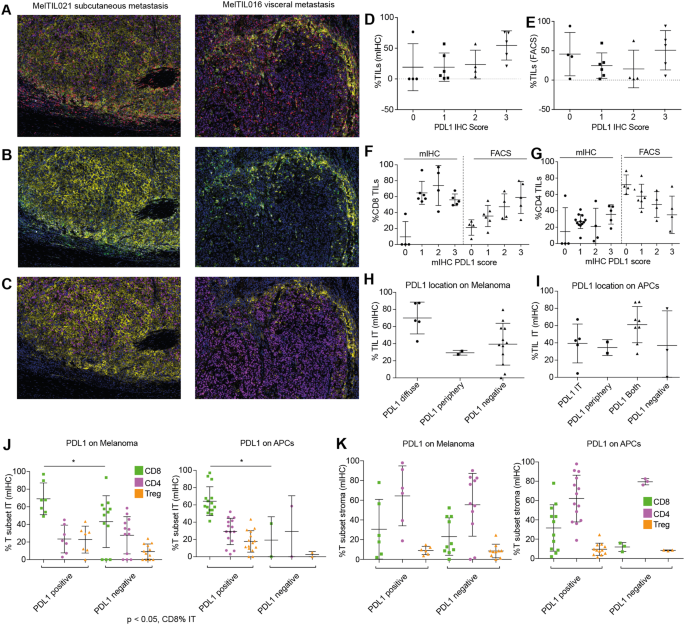
Focusing on the expression characteristics of PD-L1 in metastatic melanoma, this study used mIHC technology to clarify its expression cell types and tissue localization, further analyzing the correlation between PD-L1 expression score and TILs as well as related T cell distribution, revealing the intrinsic association between PD-L1 expression and the tumor immune microenvironment, and providing experimental reference for clinical immunotherapy response prediction. The experiment used OPAL staining combined with the Vectra automated imaging system, distinguishing PD-L1 expression on melanoma cells and antigen-presenting cells through color separation technology. A PD-L1 score was developed based on the proportion of PD-L1⁺ cells, and the correlation between this score and the proportion of TILs, CD8⁺/CD4⁺ T cell proportions detected by mIHC/FACS was analyzed, with Mann-Whitney test used for statistical analysis. After integrating staining imaging and quantitative data, it was found that PD-L1 expression could be clearly distinguished on melanoma cells and antigen-presenting cells through color separation technology: for example, in some samples, PD-L1 was mainly expressed on melanoma cells, while in others, it was mainly expressed on antigen-presenting cells. Statistical analysis revealed a positive correlation between PD-L1 expression score and TILs proportion, especially with CD8⁺ T cell infiltration. Samples with high PD-L1 expression showed significantly higher CD8⁺ T cell infiltration in the tumor margin and stroma, suggesting that PD-L1 expression is induced by T cell infiltration and may serve as a biomarker for immune response.
IV. Summary
Through the combined application of mIHC and FACS technologies, this study systematically explored the immune microenvironment heterogeneity of metastatic melanoma, clarified the complementary value of the two detection technologies, established a 4-class immune microenvironment classification model based on immune indicators, and preliminarily verified the association between this model and CBI treatment response. The study fills the gap between traditional detection techniques and modern flow cytometry techniques, improves the immune typing theory of metastatic melanoma, and provides new ideas and basis for precise immunotherapy. Despite limitations such as small sample size and insufficient follow-up, the study still has important methodological, theoretical, and clinical significance, laying a foundation for subsequent cancer immune microenvironment research and clinical translation.
References
Halse H, Colebatch AJ, Petrone P, Henderson MA, Mills JK, Snow H, Westwood JA, Sandhu S, Raleigh JM, Behren A, Cebon J, Darcy PK, Kershaw MH, McArthur GA, Gyorki DE, Neeson PJ. Multiplex immunohistochemistry accurately defines the immune context of metastatic melanoma. Sci Rep. 2018 Jul 24;8(1):11158. doi: 10.1038/s41598-018-28944-3. PMID: 30042403; PMCID: PMC6057961.
EnkiLife mIHC TSA Kits
Product | Catalog Number |
|---|---|
TSA Six-Label Seven-Color Multiplex Immunohistochemistry Kit | |
TSA Five-Label Six-Color Multiplex Immunohistochemistry Kit | |
TSA Four-Label Five-Color Multiplex Immunohistochemistry Kit | |
TSA Three-Label Four-Color Multiplex Immunohistochemistry Kit | |
TSA Two-Label Three-Color Multiplex Immunohistochemistry Kit |