Literature Sharing: Multiplex Immunofluorescence Staining of Colorectal Cancer Tumor Immune Microenvironment
Background
The tumor immune microenvironment (TME) of colorectal cancer contains key biomarkers for host anti-tumor immune responses and tumor immune escape mechanisms. The density of T cell subsets such as CD3⁺ and CD8⁺ T cells has been proven to more accurately predict disease recurrence risk than traditional histopathological staging. Additionally, tissue-resident memory T cells expressing CD103 play important roles in anti-tumor immunity for colorectal cancer and other tumors, with their density correlating with long-term oncological outcomes. Therefore, precise characterization of the phenotype, function, and spatial distribution of immune cells in the TME is crucial for discovering novel prognostic markers and guiding immunotherapeutic strategies. However, traditional chromogenic immunohistochemistry (IHC) has limitations such as limited marker detection, difficulty in co-localization analysis, prone to results deviation, and being time-consuming. Multiplex immunofluorescence (mIF) can simultaneously evaluate multiple markers, enabling precise classification of immune cells and spatial feature analysis with tumor tissues, providing an ideal tool for TME research. TSA-based mIF technology does not require consideration of primary antibody species or immunoglobulin subclass, and has high signal sensitivity and brightness, superior to traditional indirect immunofluorescence.
Therefore, Cohen R et al.'s study "Optimising multiplex immunofluorescence staining for characterising the tumour immune micro-environment" optimized the process to precisely characterize immune cells in colorectal cancer TME using a 5-color TSA-mIF detection system based on an automated staining platform and conventional fluorescence scanner.
Experimental Design
The study used tissue microarrays containing healthy colonic epithelium, colorectal adenomas of different grades, and adenocarcinomas, as well as colorectal cancer tissues as samples. The core detection markers were CD3, CD8, CD103, and cytokeratin (CK), with DAPI as the nuclear staining marker. First, primary antibody concentrations were optimized by chromogenic IHC, followed by single-color fluorescence staining verification based on TSA technology. Then, spectral crosstalk of different fluorophores in each channel of the conventional fluorescence microscope scanner was evaluated, and the effect of different staining orders of detection markers on signal intensity was explored. Finally, the optimal staining order was determined. The staining process relied on an automated staining platform, and a double-assignment fluorophore addition strategy was adopted, with control experiments set up. StrataQuest v.7.1 software was used for image analysis: first, masks for epithelial and stromal regions were generated based on CK signals, then nuclear segmentation was performed using DAPI signals to identify individual cells, followed by overlaying CD3, CD8, and CD103 signals. Finally, the density of target cells in different regions was quantitatively analyzed, and repeatability verification was achieved by calculating the consistency correlation coefficient.
Primary Antibody Concentration Optimization and Single-Color Fluorescence Staining Verification
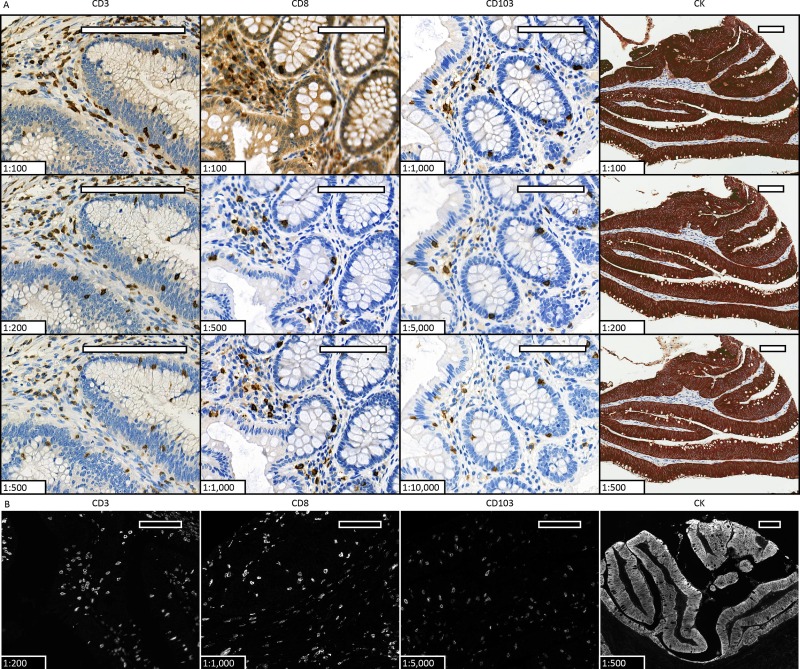
Four detection markers, CD3, CD8, CD103, and CK, were stained with DAB, with primary antibodies set at different dilution ratios and incubation times. Based on the optimized primary antibody conditions from chromogenic IHC, CD3, CD8, and CD103 were labeled with Opal 620, and CK was labeled with TSA-Cy5 for single-color fluorescence staining. The results were consistent with IHC staining.
Spectral Crosstalk Evaluation of Fluorophores in Single-Color Fluorescence Staining
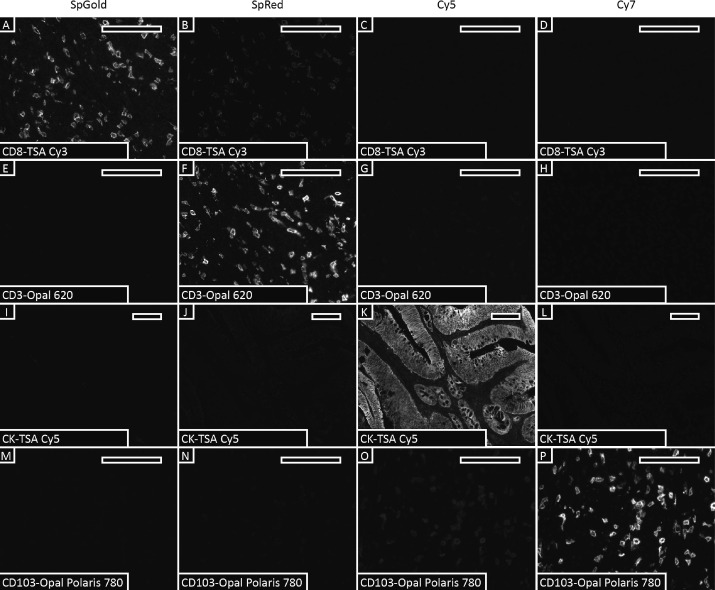
Spectral crosstalk was carefully evaluated for each primary antibody-fluorophore combination in multiplex detection. Single-color stained sections were scanned in all channels to determine the presence of spectral crosstalk. CD8-TSA Cy3 showed slight crosstalk to the SpRed channel, and CD103-Opal Polaris 780 showed slight crosstalk to the Cy5 channel. These results provided key basis for subsequent fluorophore assignment and staining order optimization, and the impact of crosstalk on cell classification could be avoided through reasonable marker-fluorophore matching and signal intensity threshold setting.
Fluorophore Assignment and Staining Order Determination

Regarding fluorophore assignment, first, to address the difficulty of eluting CD103 antibodies and avoid impact on tissue and signals in subsequent steps, it was set as the last staining in multiplex detection, paired with the Opal Polaris 780 fluorophore. Three markers, CD8-Opal 620, CD3-Cy3, and CK-Cy5, were placed in positions 1, 2, and 3 of the mIF staining sequence, with a total of 6 permutations. By comparing the signal intensity of each marker at different staining positions, the optimal order was identified: CK-Cy5 remained most stable at all three positions, CD8-Opal 620 had the strongest signal intensity when stained third, and CD3-Cy3 had the weakest signal when stained first. Finally, the overall staining order was determined as CK→CD3→CD8→CD103.
Multiplex Immunofluorescence Results
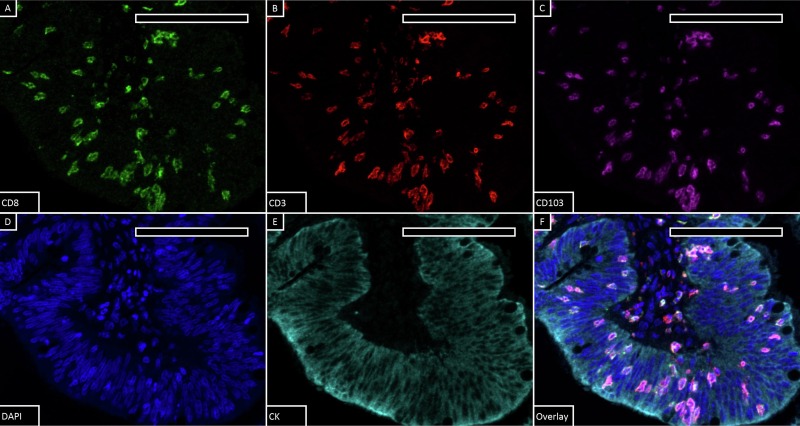
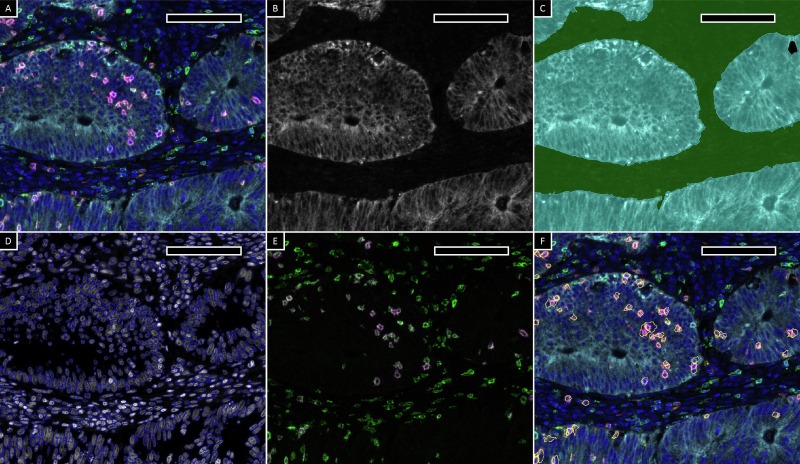
Traditional histopathological evaluation of immune cell activity in the tumor microenvironment relies on trained anatomical pathologists for feature description and semi-quantitative analysis of monochromatic tissue sections. The emergence of high-performance digital image analysis software has fully leveraged the advantages of multiplex staining technology, enabling machine-based automated cell identification, multi-marker identification, background spatial localization, and subsequent quantitative analysis. This study used StrataQuest v.7.1 software from TissueGnostics (Austria) for quantitative analysis of single-positive, double-positive, and triple-positive cells. First, masks for epithelial and stromal regions were generated using cytokeratin signals, then individual cells were identified through nuclear segmentation algorithms based on DAPI signals. Subsequently, based on the expression of CD3, CD8, and CD103, the classification of double-positive and triple-positive cells was confirmed by marker signal overlay combined with backgating technology. Finally, regional counts and area measurement data of target cells were obtained through computer quantification.
References
Cohen R, Lee-Pullen T, Miller TJ, Meehan K, Fuller K, McCoy MJ. Optimising multiplex immunofluorescence staining for characterising the tumour immune micro-environment. Methods. 2023 Nov;219:48-57. doi: 10.1016/j.ymeth.2023.09.004. Epub 2023 Sep 21. PMID: 37741563.
Enkilife mIHC TSA Kits
Product | Catalog Number |
|---|---|
TSA Six-Label Seven-Color Multiplex Immunohistochemistry Kit | |
TSA Five-Label Six-Color Multiplex Immunohistochemistry Kit | |
TSA Four-Label Five-Color Multiplex Immunohistochemistry Kit | |
TSA Three-Label Four-Color Multiplex Immunohistochemistry Kit | |
TSA Two-Label Three-Color Multiplex Immunohistochemistry Kit |