Literature Sharing: Multiplex Immunohistochemistry and Immunofluorescence Image Analysis and Data Sharing
Research Background
With the rapid development of tumor immunotherapy, precise assessment of the tumor microenvironment (TME) has become a core prerequisite for interpreting immune escape mechanisms, screening populations benefiting from immunotherapy, and optimizing treatment regimens. Traditional single-marker immunohistochemistry (IHC) and immunofluorescence (IF) techniques can only detect a single marker, failing to comprehensively present the complex composition of immune cell subsets, marker co-expression characteristics, and intercellular spatial relationships in the TME, which is insufficient to meet the needs of precise immunotherapy research and clinical applications. Against this backdrop, multiplex immunohistochemistry (mIHC) and multiplex immunofluorescence (mIF) technologies have emerged and rapidly iterated, becoming core technologies for parsing TME heterogeneity and mining immunotherapy biomarkers due to their advantage of simultaneously detecting multiple markers in tissue sections.
In recent years, mIHC and mIF technologies have been widely applied in basic research and clinical translation, covering various malignant tumors such as lung cancer, melanoma, and breast cancer. Related research results have continuously emerged, driving breakthroughs in the field of immunotherapy. However, at the same time, the standardization process of these technologies lags behind the speed of application development, especially in the links of image analysis and data management, where unified industry norms and best practice guidance are lacking, becoming a key bottleneck restricting the large-scale application, cross-institutional cooperation, and clinical implementation of the technologies.
To solve this problem, the Society for Immunotherapy of Cancer (SITC) has previously published the article "The Society for Immunotherapy in Cancer statement on best practices for multiplex immunohistochemistry (IHC) and immunofluorescence (IF) staining and validation", which details best practice guidelines related to mIHC/IF staining and validation, standardizing the front-end experimental process of the technology. However, unified standards have not yet been formed for the core back-end links such as image acquisition, processing, analysis, algorithm validation, and data sharing, resulting in poor comparability of research results and low data reproducibility across different laboratories and technical platforms, making it difficult to transform into clinically usable diagnostic bases and treatment references. Based on this, SITC led the organization of global multidisciplinary experts, combining existing research results and practical experience, to formulate and publish the article "Society for Immunotherapy of Cancer: updates and best practices for multiplex immunohistochemistry (IHC) and immunofluorescence (IF) image analysis and data sharing", focusing on the standardization construction of image analysis and data sharing, filling industry gaps, promoting the standardized transformation of mIHC/IF technology from scientific research to clinical practice, and providing technical support for precise immunotherapy.
mIHC/IF Image Analysis Best Practices and Corresponding Result Figure Analysis
1、mIF Stained Slide Scanning
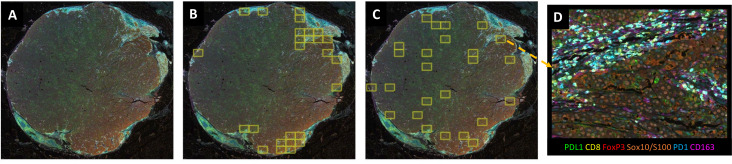
The study took advanced melanoma samples as research objects and intuitively presented multiple standardized sampling strategies for HPF/ROI in mIF image analysis through four subfigures: panoramic scan after mIF staining, hot spot area sampling, heterogeneity capture sampling, and high-resolution high-power field examples. Among them, the panoramic scan clarified the overall tissue structure and immune cell distribution pattern, hot spot sampling focused on the CD8+T cell high-density area at the tumor-stroma interface, heterogeneity sampling covered different tumor areas to avoid selection bias, and high-resolution HPF provided high-quality input for downstream precise analysis. This figure addresses the pain points of inconsistent ROI selection and insufficient sampling representativeness in existing studies, provides visual support for the image acquisition standardization suggestions in the article, clarifies the adaptation scenarios of different sampling strategies, helps improve the consistency of sampling processes across laboratories, and lays a foundation for the reliability of subsequent quantitative analysis.
2、mIHC/IF Image Color Vector Separation Effect Validation
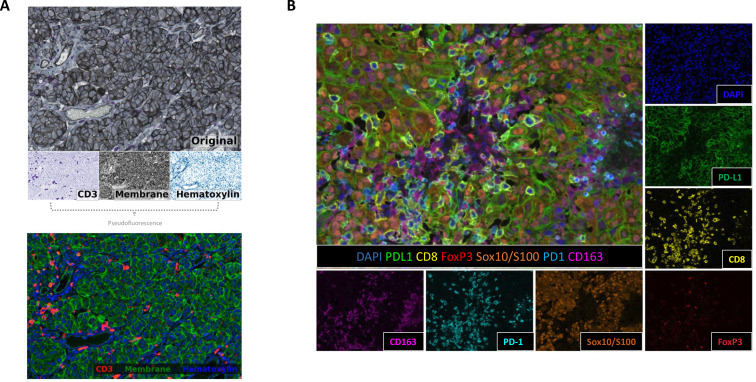
The results are divided into two parts: mIHC color deconvolution and mIF spectral unmixing, clearly demonstrating the practical effects of the two technologies in separating marker signals. mIHC completes color deconvolution through QuPath tools, separating mixed staining into independent color vectors and converting them into pseudo-fluorescence images, solving the problem of signal overlap in traditional mIHC staining. mIF uses inForm tools combined with fluorophore emission spectral unmixing to separate individual signals from a 6-marker panel plus DAPI, effectively avoiding fluorescence crosstalk interference. This figure not only validates the effectiveness of color deconvolution and spectral unmixing technologies but also clarifies the standardized operation tools and processes of the two technologies, providing reference for different laboratories to select appropriate signal separation methods, reducing analysis errors caused by non-standard signal separation, and improving the comparability of results.
3、Tissue Segmentation, Cell Segmentation and Pixel-level Analysis
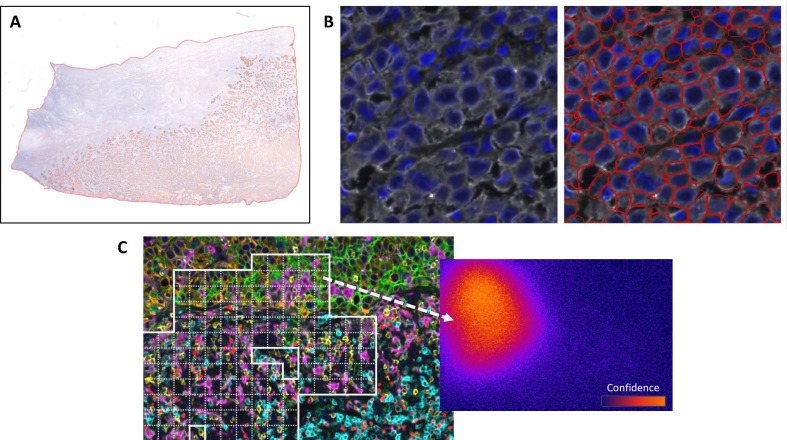
This figure focuses on the core processing links of mIHC/IF image analysis, comparing the practical effects and adaptation scenarios of three key analysis methods through three subfigures. Tissue segmentation precisely delineates the analysis area through QuPath tools, excluding irrelevant background interference. Cell segmentation achieves single-cell resolution labeling with the Mesmer algorithm, solving the problem of irregular cell segmentation errors in melanoma samples. Pixel-level analysis generates confidence heatmaps through the NaroNet algorithm, adapting to the analysis needs of morphologically abnormal cells or artifact areas. This experiment provides practical basis for the selection of segmentation methods, clarifies the advantages and disadvantages of different segmentation methods and their applicable scenarios, helps researchers select appropriate analysis strategies based on sample types and research purposes, and emphasizes the important impact of segmentation accuracy on subsequent phenotypic analysis and the reliability of quantitative results.
4、Iterative Development and Performance Validation of Phenotypic Analysis Algorithms
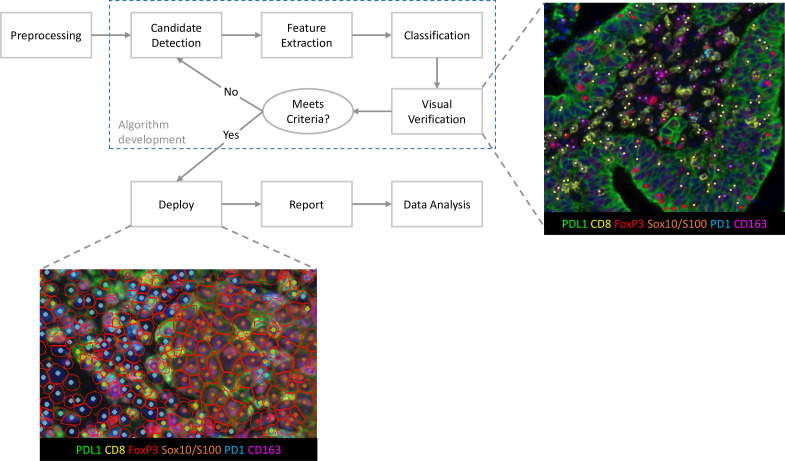
In the form of flowcharts combined with practical examples, it completely presents the standardized development and validation process of mIHC/IF phenotypic analysis algorithms, covering key steps such as preprocessing, candidate detection, feature extraction, classification, visual validation, iterative optimization, and final deployment. Through practical examples of non-small cell lung cancer and advanced melanoma samples, it demonstrates the full process of algorithm from development, validation to optimization, clarifies the core role of pathologist visual validation in algorithm optimization, and the standardized presentation method of algorithm output results. It solves the problem of irreproducible results caused by non-standard algorithm development and missing validation processes in existing studies, provides a standardized process reference for laboratories to develop and optimize phenotypic analysis algorithms, and ensures the accuracy and consistency of phenotypic classification results.
5、Standardized Application of Annotation Tools inTME Region Screening
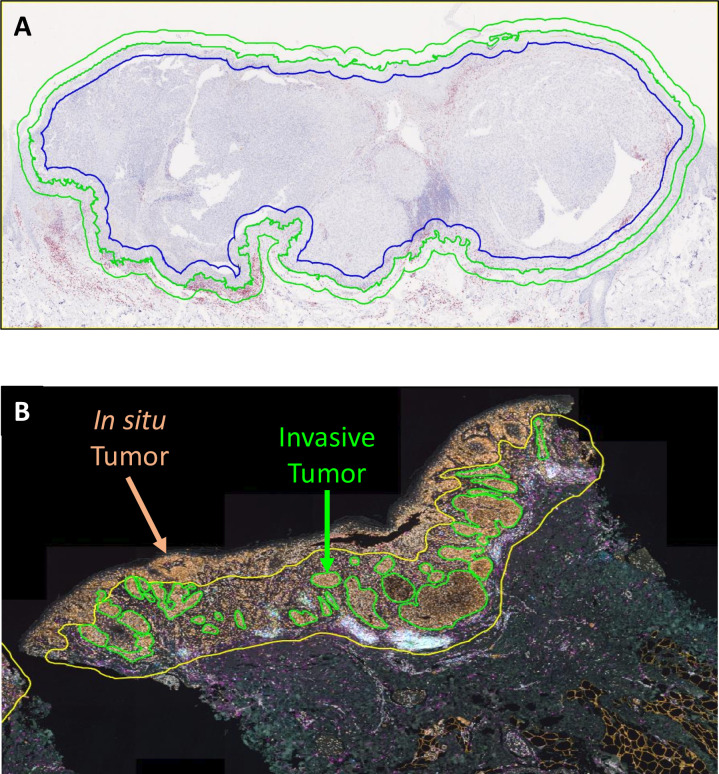
Taking melanoma and skin biopsy samples as examples, the figure shows the standardized operation of annotation tools in region screening for mIHC/IF image analysis. In this example, annotations are generated through HALO software, and image analysis tools can expand the annotation range according to preset increments, providing standardized and reproducible research methods for characteristic analysis of tumor surrounding areas. Annotation tools can also be used to exclude areas that do not need analysis. In the representative micrograph of skin biopsy sample in Figure B, after mIF staining, HALO software is used to label invasive melanoma nodules (green lines), and yellow lines delineate the tumor microenvironment area included in the final analysis, deliberately excluding in situ melanoma tissue in the upper epidermis according to the pre-set research design. This figure clarifies the standardized usage method of annotation tools, emphasizes the importance of annotation strategy pre-definition and operation consistency, solves the pain points of subjective region screening and inconsistent standards in existing studies, effectively avoids analysis result distortion caused by region screening bias, and improves the reliability and reproducibility of research results.
6、Feasibility Validation of Serial Section Image Registration and Merged Analysis
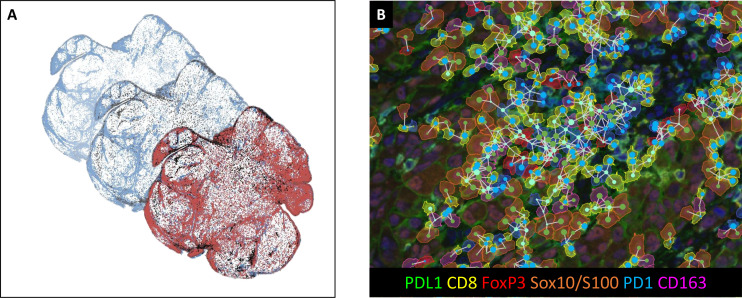
The figure takes serial sections as research objects, demonstrating the full process of IHC detection, image scanning, HALO registration, and MATLAB merged analysis, validating the feasibility of serial section technology in expanding mIHC/IF detection complexity. At the same time, through cell phenotype coloring, PD-1/PD-L1 expression level labeling, and proximity analysis, it realizes comprehensive analysis of multiple markers and multiple sections, providing a new path for comprehensively parsing TME heterogeneity.
Summary
The literature systematically expounds the standardized methods for the entire process of mIHC/IF image analysis, covering five key links: image acquisition emphasizes the use of whole-slide imaging technology to avoid bias caused by marker expression heterogeneity, while standardizing ROI/HPF sampling strategies, recommending the collection of at least 5 high-power fields to ensure representativeness. Color deconvolution and spectral unmixing can effectively separate marker signals, recommended to be completed with the help of QuPath, inForm and other tools to reduce staining overlap or fluorescence crosstalk. Tissue and cell segmentation compares the advantages and disadvantages of single-cell resolution segmentation and pixel-level analysis, and recommends the use of classification-type independent segmentation for irregular cells such as macrophages. Phenotypic analysis introduces the application of threshold methods and machine learning classifiers, emphasizing the combination of the two methods to improve accuracy. Algorithm validation highlights the core role of pathologist visual validation, requiring iterative optimization to reduce missed detection and false detection.
The above work will further promote the application of mIHC/IF technology in tumor immunology research, facilitate cross-institutional cooperation and data sharing, and provide important support for the development of precise immunotherapy. In the future, it is necessary to continuously improve the standardization system of mIHC/IF image analysis, optimize image analysis methods, and give full play to its value in the field of cancer immunotherapy through large-scale multi-center research, technological innovation, and industry collaboration.
References
Taube JM, Sunshine JC, Angelo M, Akturk G, Eminizer M, Engle LL, Ferreira CS, Gnjatic S, Green B, Greenbaum S, Greenwald NF, Hedvat CV, Hollmann TJ, Jiménez-Sánchez D, Korski K, Lako A, Parra ER, Rebelatto MC, Rimm DL, Rodig SJ, Rodriguez-Canales J, Roskes JS, Schalper KA, Schenck E, Steele KE, Surace MJ, Szalay AS, Tetzlaff MT, Wistuba II, Yearley JH, Bifulco CB. Society for Immunotherapy of Cancer: updates and best practices for multiplex immunohistochemistry (IHC) and immunofluorescence (IF) image analysis and data sharing. J Immunother Cancer. 2025 Jan 8;13(1):e008875. doi: 10.1136/jitc-2024-008875. PMID: 39779210; PMCID: PMC11749220.
EnkiLife mIHC TSA Kits
Product | Catalog Number |
|---|---|
TSA Six-Label Seven-Color Multiplex Immunohistochemistry Kit | |
TSA Five-Label Six-Color Multiplex Immunohistochemistry Kit | |
TSA Four-Label Five-Color Multiplex Immunohistochemistry Kit | |
TSA Three-Label Four-Color Multiplex Immunohistochemistry Kit | |
TSA Two-Label Three-Color Multiplex Immunohistochemistry Kit |